講師: 陳倩瑜
Feature Selection 課程組織
屬性的選擇
Clustering:分群
(Unsupervised Learning)
Classification: 分類
(Supervised Learning)
這堂課的大鋼會比較涵蓋在演算法上, 一些函數的背景理論與應用.
首先假設我們拿到的資料已經經過整理,
來自不同病人的資料整理成一個二維的陣列.
縱軸可能是 時間的差異, Condition,
----------------------------------------
| sample |
----------------------------------------
| gene1  |
----------------------------------------
| gene2  |
----------------------------------------
若作clustering, 屬性相同的會被歸類在一起.Data Clustering concerns how to group similar objects together while spearating dissimilar objects.如何判斷行不行? 當你拿到一群資料的時候, 就可以從一大群資料去判斷有甚麼關連性, 以及如何分群.
這樣的方法在很多地方都有用到, 如: machine learning, Data mining, Pattern recognition, Image Analysis, Bioinformatics.
Hierarchical
http://en.wikipedia.org/wiki/Cluster_analysis
http://nlp.stanford.edu/IR-book/html/htmledition/hierarchical-agglomerative-clustering-1.html
巢狀式,
階層式 (應用在基因的概念上)
Agglomerative
Divisive
HAC (hierarchical agglomerative clustering) 先把像的東西放在一起, 決定第一刀切在哪裡.
方法如下:
1. 先決定兩個人的相似程度, 比如: A有25000個FEATURE, B有25000個FEATURE
Proximity matrix containing the distance between each pair of objects. Treat each object as cluster.
2. 把兩個最像的東西放在一起, UPDATE 剛剛的MATRIX
> class(iris)
[1] “data.frame”
> dim(iris)
[1] 150 5
> class(iris[1])
[1] “data.frame”
> class(iris[2])
[1] “data.frame”
> class(iris[4])
[1] “data.frame”
> class(iris[,1])
[1] “numeric”
> class(iris[,2])
[1] “numeric”
> class(iris[,6])
錯誤在`[.data.frame`(iris, , 6) : undefined columns selected
> class(iris[,5])
[1] “factor”
> table(iris[,5])setosa versicolor virginica
50 50 50
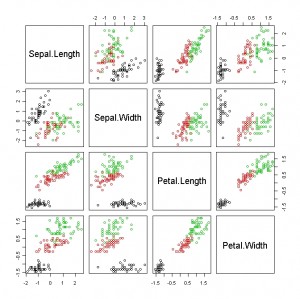
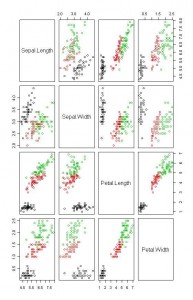
用 Iris 來繪圖 > plot(iris[1:4], col=iris[,5]) ,
顏色表示以第五個欄位來分類(因為有三個category,所以有三種顏色)
分群常用指令:
> h <- agnes(iris[3:4])
> h
Call: agnes(x = iris[3:4])
Agglomerative coefficient: 0.9791964
Order of objects:
[1] 1 2 5 9 29 34 48 50 3 37 39 43 7 18 46 41 42 4 8 11
[21] 28 35 40 49 20 12 26 30 31 47 21 10 33 13 38 17 6 27 24 19
[41] 16 22 32 44 14 15 36 23 25 45 51 64 77 59 92 57 87 52 67 69
[61] 79 85 55 86 107 74 56 88 66 76 91 75 98 95 97 96 62 54 72 90
[81] 89 100 93 60 63 68 70 83 81 58 94 61 80 82 65 99 53 73 84 120
[101] 134 71 127 139 124 128 78 102 143 147 150 111 148 114 122 112 101 110 136 103
[121] 105 121 144 137 141 145 113 140 125 129 133 115 142 116 146 149 104 117 138 109
[141] 130 135 106 123 118 119 108 132 126 131
Height (summary):
Min. 1st Qu. Median Mean 3rd Qu. Max.
0.0000 0.0000 0.1000 0.1864 0.2038 3.7370Available components:
[1] “order” “height” “ac” “merge” “diss” “call” “method” “data”
> h$order
[1] 1 2 5 9 29 34 48 50 3 37 39 43 7 18 46 41 42 4 8 11
[21] 28 35 40 49 20 12 26 30 31 47 21 10 33 13 38 17 6 27 24 19
[41] 16 22 32 44 14 15 36 23 25 45 51 64 77 59 92 57 87 52 67 69
[61] 79 85 55 86 107 74 56 88 66 76 91 75 98 95 97 96 62 54 72 90
[81] 89 100 93 60 63 68 70 83 81 58 94 61 80 82 65 99 53 73 84 120
[101] 134 71 127 139 124 128 78 102 143 147 150 111 148 114 122 112 101 110 136 103
[121] 105 121 144 137 141 145 113 140 125 129 133 115 142 116 146 149 104 117 138 109
[141] 130 135 106 123 118 119 108 132 126 131
> h$height
[1] 0.0000000 0.0000000 0.0000000 0.0000000 0.0000000 0.0000000 0.0000000 0.1000000
[9] 0.0000000 0.0000000 0.0000000 0.1193300 0.0000000 0.0000000 0.1000000 0.0000000
[17] 0.1884517 0.0000000 0.0000000 0.0000000 0.0000000 0.0000000 0.0000000 0.1000000
[25] 0.1214732 0.0000000 0.0000000 0.0000000 0.0000000 0.1000000 0.1599476 0.0000000
[33] 0.1000000 0.0000000 0.2577194 0.2986122 0.1000000 0.1207107 0.1471405 0.1868034
[41] 0.0000000 0.0000000 0.2217252 0.3709459 0.1414214 0.0000000 0.1804738 0.4836443
[49] 0.2000000 3.7365080 0.0000000 0.1000000 0.1510749 0.1000000 0.1869891 0.1000000
[57] 0.2335410 0.0000000 0.0000000 0.0000000 0.0000000 0.1000000 0.1554190 0.1000000
[65] 0.3195579 0.3582523 0.1000000 0.1207107 0.0000000 0.1603553 0.2038276 0.0000000
[73] 0.1000000 0.0000000 0.1207107 0.2598380 0.5662487 0.0000000 0.0000000 0.1000000
[81] 0.0000000 0.1165685 0.1825141 0.2663756 0.1000000 0.2352187 0.1000000 0.1207107
[89] 0.9780526 0.0000000 0.2666667 0.0000000 0.2000000 0.3594423 0.4986370 1.5284638
[97] 0.0000000 0.1745356 0.1207107 0.1000000 0.3927946 0.0000000 0.0000000 0.1000000
[105] 0.0000000 0.1907326 0.2947898 0.0000000 0.1000000 0.1138071 0.1589347 0.1000000
[113] 0.1898273 0.1000000 0.2521467 0.8001408 0.1000000 0.2118034 0.4796864 0.2080880
[121] 0.1414214 0.1707107 0.2979830 0.0000000 0.1414214 0.3207243 0.1000000 0.1941714
[129] 0.1207107 0.1000000 0.5593867 0.1000000 0.2135427 0.1000000 0.1500000 0.6629414
[137] 0.1000000 0.0000000 0.3006588 0.2000000 0.3909355 1.1817205 0.1414214 0.1707107
[145] 0.3149057 0.6020066 0.2236068 0.3217620 0.1414214
> iris[h$order[1:50],5] //找出1到50已經分群的資料
[1] setosa setosa setosa setosa setosa setosa setosa setosa setosa setosa setosa
[12] setosa setosa setosa setosa setosa setosa setosa setosa setosa setosa setosa
[23] setosa setosa setosa setosa setosa setosa setosa setosa setosa setosa setosa
[34] setosa setosa setosa setosa setosa setosa setosa setosa setosa setosa setosa
[45] setosa setosa setosa setosa setosa setosa
Levels: setosa versicolor virginica> k <- agnes(iris[1:4])
> k
Call: agnes(x = iris[1:4])
Agglomerative coefficient: 0.9300174
Order of objects:
[1] 1 18 41 28 29 8 40 50 5 38 36 24 27 44 21 32 37 6 19 11 49 20 22 47 17 45 2 46 13 10 35 26 3 4
[35] 48 30 31 7 12 25 9 39 43 14 23 15 16 33 34 42 51 53 87 77 78 55 59 66 76 52 57 86 64 92 79 74 72 75
[69] 98 69 88 120 71 128 139 150 73 84 134 124 127 147 102 143 114 122 115 54 90 70 81 82 60 65 80 56 91 67 85 62 89 96
[103] 97 95 100 68 83 93 63 107 58 94 99 61 101 121 144 141 145 125 116 137 149 104 117 138 112 105 129 133 111 148 113 140 142 146
[137] 109 135 103 126 130 108 131 136 106 123 119 110 118 132
Height (summary):
Min. 1st Qu. Median Mean 3rd Qu. Max.
0.0000 0.2189 0.3317 0.4377 0.5081 4.0630Available components:
[1] “order” “height” “ac” “merge” “diss” “call” “method” “data”
> table(iris[k$order[101:150],5])setosa versicolor virginica
0 13 37
> table(iris[k$order[1:50],5])setosa versicolor virginica
50 0 0
Measures of Dissimilarity/Similarity Between Objects
- Euclidean Distance
- Pearson Correlation coefficient
Normalization
- Decimal Scaling
- Min-Max normalization
for normalized interval [0,1] - Standard deviation normalization
- 在R作normalization可使用scale, 範例如下:
> j <- data.frame(scale(iris[1:4])) //先轉換為data.frame (因為SCALE之後就是matrix)
> class(j) //查看j 的資料結構
[1] “data.frame”
> plot(j, col=iris[,5]) //畫圖

TIPS:
1. 太高維度的OBJECT就不再相像
2. 分群其實沒有標準答案, 怎麼分是由自己決定; 應該是由自己分群後再向別人解釋自己的方法以及結果.
3. 東西如果像, 怎麼分都會在一起(如使用Single-Link與 Complete Link 演算法).
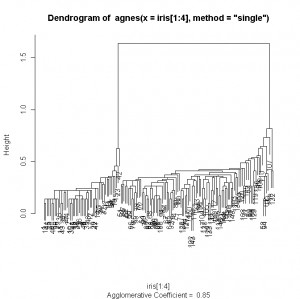
4. 點跟點的距離, 群跟群的距離決定了不同的結果. 這就是為甚麼不同的Algorithm會造成不同的樹狀圖.
> plot(agnes(iris[1:4], method=”single”))
//使用single-link演算法畫出的樹狀圖, 會發現分得不錯, 有兩大族群
//UPGMA (Average Link)
Practise:
1. x <- read.delim(filechoose(), row.names = 1, header= TRUE)
2. mean(as.numeric(x[1:27]))
3. a <- function(y) {
(mean(as.numeric(x[y,1:27])) – mean(as.numeric(x[y,28:38])) ) / (sd(as.numeric(x[y,1:27])) – sd(as.numeric(x[y,28:38])) )
}
4. for(i in 1:7129) {
x[i] = a(i);
}
Partitional
K-Means


發佈留言